Why Louisiana is Always Last
Like the climate crisis itself, it’s difficult to make this comprehensive graph small enough for social media platforms, but the small font on the left lists the states in alphabetical order.
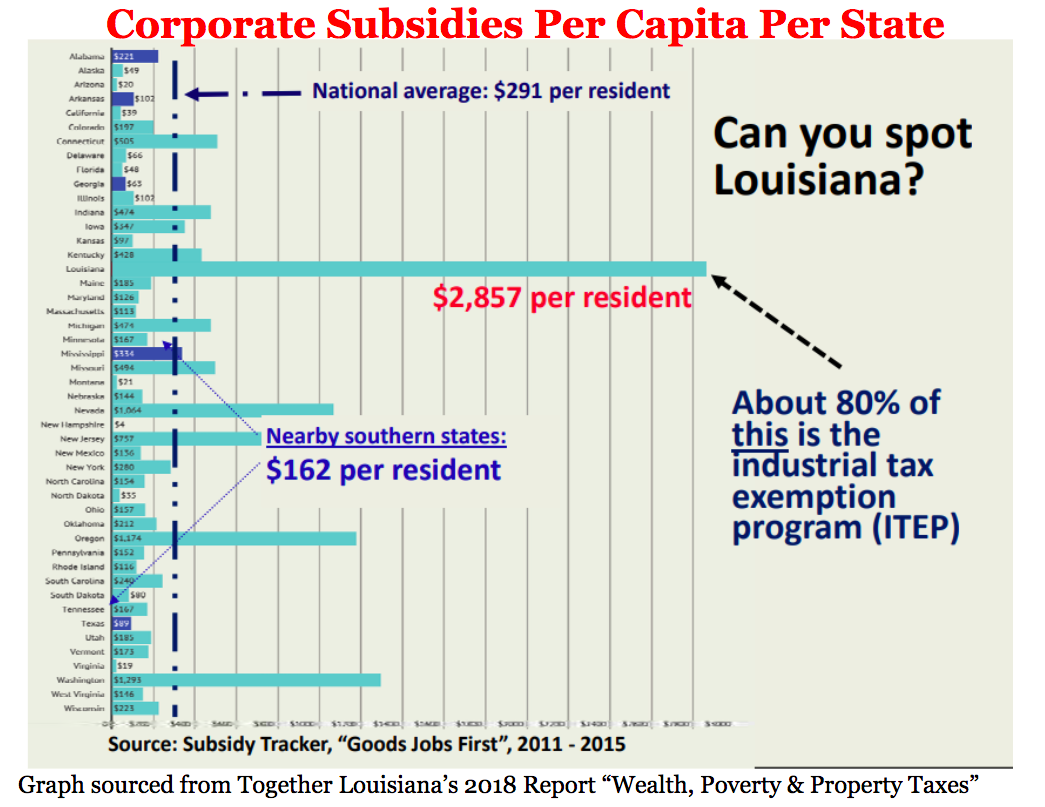
Louisiana is easy to spot even if it’s hard to make out the text. 🎶 One of these things is not like the other, one of these things doesn’t belong 🎶
Important to note: One of the reasons why this graph is so hard to read is because Louisiana is such an outlier. Our corporate tax subsidies per capita are so preposterous that it was almost impossible to fit on this graph.
It’s also important to note that Together Louisiana created this graph based on data collected between 2011-2015, so it predates the revisions John Bel Edwards made to the Industrial Tax Exemption Program (ITEP) in 2016. The most notable of those revisions reduced company’s property tax rates from 100% to 80% over 5 years.
But even if you adjust this graph to reflect the 2016 revisions–and a 20% outright cut in ITEP dollars–Louisiana would still have given away $2,400 per resident between 2011-2015. That is still 8 times higher than the national average, and almost double Washington State’s $1,293 per resident–the second highest rate in the country.
This graph was a part of Together Louisiana’s 2018 report “Wealth, Poverty & Property Taxes,” and it remains one of the best visuals explaining why Louisiana stays poor. It explains why Louisiana is either 49 or 50–and sometimes 1 or 2–on all national metrics that catalogue our successes or our failures. It is backdoor corporate and political corruption called on the carpet. It is indisputable proof that our state policies are failing us.
Last week, when Governor Landry’s office didn’t apply for the EBT summer program because it was too expensive and inefficient, this graph popped in my head again. Landry isn’t willing to spend $6 on each of the 600,000 food-insecure children in the state, but he is willing–and eager–to take $2,400 potential tax dollars away from each Louisiana citizen and trickle it up to companies.
On top of that, he finds it unnecessary to require those companies to reinvest those tax dollars back into the state.
Side note (but not really a side note because all of this is systemic and connected): At the moment, Landry is in Baton Rouge, holding a special session about Louisiana’s criminal justice system. He plans to criminalize juveniles, restrict parole eligibility, and strengthen police immunity. Landry wants to put more people in jail and keep them there longer, all in an effort to grow Louisiana’s Prison Industrial Complex. (And Louisiana already incarcerates a higher percentage of its people than any other democracy–on the planet.)
If Landry looked at this corporate subsidies graph, it is unlikely that he’d find anything wrong with it. In fact, his plans include making the state a friendlier, more hospitable place for industry, which involves lowering regulations and taxes for the companies that continue to take so much potential from the state and its people.
With Landry’s leadership, this graph will become even more difficult to read as Louisiana gives more and more away to corporations. Because the blurrier this map gets, the more attractive Louisiana becomes to the industries that want to exploit it.